Lovelace Visualization
The source of this example is made by Kim Storøy, and Otto Paulsen has written the documentation and made some changes to the files.
Introduction
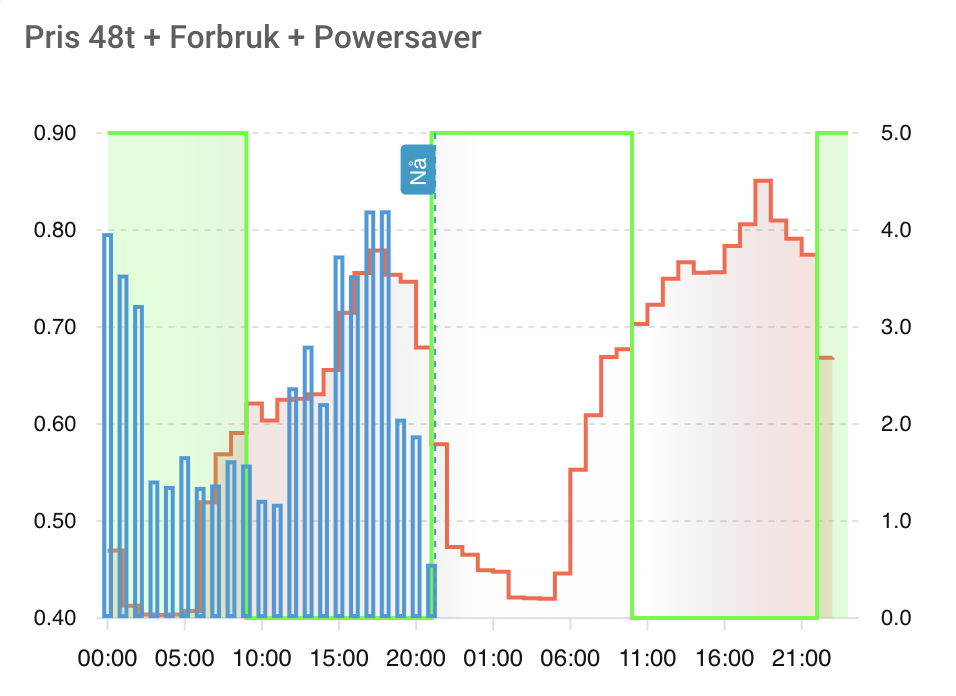
With this example you can visualize the schedule together with the price and the consumption in Lovelace, as shown above.
Installation
You need the following installed before you can use this example:
- The Node-RED Companion Integration.
- The apexcharts-card
- The Tibber integration (Configuration -> Integrations)
If you don't already have them, install them first.
In Node-RED, select Import from the menu, and paste the code for nodes below. Connect them like this:

In Lovelace, use the Lovelace code below for the new card. Replace the sensor.accumulated_consumption_current_hour_your_address with the correct name for your corresponding sensor in your Tibber integration.
Code
Nodes
[
  {
    "id": "a6c0472f7981fad2",
    "type": "function",
    "z": "d938c47f.3398f8",
    "name": "Reduce minutes count",
    "func": "const minutes = []\nlet previousHour = \"\"\nlet previousSaving = null\nmsg.payload.minutes.forEach(m => {\n  const hour = m.start.substring(0, 13)\n  if (hour !== previousHour || m.saving !== previousSaving) {\n    minutes.push(m)\n    previousHour = hour\n    previousSaving = m.saving\n  }\n})\n\nmsg.payload.minutes = minutes\nmsg.payload.hours = minutes\n\nreturn msg;",
    "outputs": 1,
    "timeout": 0,
    "noerr": 0,
    "initialize": "",
    "finalize": "",
    "libs": [],
    "x": 640,
    "y": 640,
    "wires": [["cad33a63f66ef72e"]]
  },
  {
    "id": "cad33a63f66ef72e",
    "type": "function",
    "z": "d938c47f.3398f8",
    "name": "Convert true/false to 1/0",
    "func": "msg.payload.minutes.forEach(h => h.onOff = h.onOff ? \"1\" : \"0\")\nreturn msg;",
    "outputs": 1,
    "timeout": "",
    "noerr": 0,
    "initialize": "",
    "finalize": "",
    "libs": [],
    "x": 880,
    "y": 640,
    "wires": [["4e2452b33c54d90b"]]
  },
  {
    "id": "4e2452b33c54d90b",
    "type": "ha-sensor",
    "z": "d938c47f.3398f8",
    "name": "Info fra PS til HA",
    "entityConfig": "eab799518168f5a3",
    "version": 0,
    "state": "payload",
    "stateType": "str",
    "attributes": [
      { "property": "Schedule", "value": "payload.schedule", "valueType": "msg" },
      { "property": "Hours", "value": "payload.hours", "valueType": "msg" },
      { "property": "Control", "value": "payload.minutes[0].onOff", "valueType": "str" },
      { "property": "Current", "value": "payload.current", "valueType": "str" },
      { "property": "Minutes", "value": "payload.minutes", "valueType": "msg" }
    ],
    "inputOverride": "allow",
    "outputProperties": [],
    "x": 1100,
    "y": 640,
    "wires": [[]]
  },
  {
    "id": "eab799518168f5a3",
    "type": "ha-entity-config",
    "server": "ec4a12a1.b2be9",
    "deviceConfig": "",
    "name": "sensor config for Info fra PS til HA",
    "version": 6,
    "entityType": "sensor",
    "haConfig": [
      { "property": "name", "value": "Powersaver" },
      { "property": "device_class", "value": "" },
      { "property": "icon", "value": "" },
      { "property": "unit_of_measurement", "value": "" },
      { "property": "state_class", "value": "" },
      { "property": "last_reset", "value": "" }
    ],
    "resend": true
  }
]
Lovelace
type: custom:apexcharts-card
header:
  show: true
  title: Pris 48t + Forbruk + Powersaver
now:
  show: true
  label: Nå
graph_span: 2d
span:
  start: day
apex_config:
  stroke:
    width: 2
  dataLabels:
    enabled: true
  fill:
    type: gradient
    gradient:
      shadeIntensity: 1
      inverseColors: false
      opacityFrom: 0.45
      opacityTo: 0.05
      stops:
        - 10
        - 50
        - 75
        - 1000
  legend:
    show: false
  yaxis:
    - id: price
      show: true
      decimalsInFloat: 2
      floating: false
      forceNiceScale: true
      extend_to: end
    - id: usage
      show: true
      opposite: true
      decimalsInFloat: 1
      floating: false
      forceNiceScale: true
      extend_to: end
    - id: powersaver
      show: false
      decimalsInFloat: 0
      floating: false
      extend_to: now
series:
  - entity: sensor.powersaver
    yaxis_id: price
    extend_to: now
    name: Pris
    type: area
    curve: stepline
    color: tomato
    show:
      legend_value: false
    data_generator: |
      return entity.attributes.minutes.map((entry) => {
        return [new Date(entry.start), entry.price];
      });
  - entity: sensor.accumulated_consumption_current_hour_xxx
    yaxis_id: usage
    type: column
    name: Forbruk
    group_by:
      func: max
    show:
      legend_value: false
    curve: smooth
  - entity: sensor.powersaver
    data_generator: |
      return entity.attributes.minutes.map((entry) => {
        return [new Date(entry.start), entry.onOff];
      });
    yaxis_id: powersaver
    name: " "
    type: area
    color: rgb(0, 255, 0)
    opacity: 0.2
    stroke_width: 0
    curve: stepline
    group_by:
      func: min
    show:
      legend_value: false
      in_header: false
      name_in_header: false
      datalabels: false